Cache hits are capacity : What serving a voice LLM taught us about latency
A slow first response can disrupt an entire voice conversation. We found that prompt design and cache reuse mattered more for latency than we expected. By restructuring prompts, improving cache hits and routing requests more carefully, we cut first-token latency from about 1,780 ms to about 350 ms and carried 2.3× more calls per GPU in our tests. In this article, we share the engineering lessons, benchmarks and practical techniques that helped us improve voice LLM performance under load.
Techladder Engineering · · 16 min read

On a phone call, a pause of even a second feels like the line has dropped. If our voice agent is slow to start its reply, callers say "hello?" and talk over it, and the conversation never quite recovers.
We run our own LLM for these calls, so that pause is our problem. When we started chasing it, we expected the answers to be GPU-shaped: kernels, quantization, engine flags. Some were. But the biggest wins came from somewhere less glamorous: how much of each prompt the engine gets to reuse from the request before it. Once we measured that properly, it explained most of what we were seeing. It explained why the first turn of a call was slow, why latency fell apart under load, and how many calls one GPU can really carry.
Everything below comes from our own test cases: replays of real call requests, and a simulator that sends what a real call sends. The short version:
- Replaying real call requests, one change to how our prompts are laid out took the first turn's first token from about 1,780 ms to about 350 ms.
- In the simulator, a GPU carried 2.3x more calls when the context stayed stable and more than 90% cached, instead of around 80%.
- At the same load, the median was 3.9x lower when a GPU served 3 agent prompts instead of 12.
Some housekeeping before we start. We'll call our current model Model A and the one it replaced Model B. Model A is larger and dense, and it is far better at following instructions and at Hindi–English code-switching. We serve it with SGLang on NVIDIA H100 GPUs. We haven't benchmarked vLLM head to head, so we won't claim either engine is faster, and most of what follows applies to both anyway.
Where the time actually goes
The number we care about is time to first token (TTFT): from the moment we send the request to the moment the first token of the reply comes back. Four things happen in between. We build the request, it waits in the engine's queue, the engine runs prefill (turning the prompt into model state), and it decodes the first token.
When we broke a turn down along those lines, the picture was lopsided. About 25 ms passed before the response stream opened, and about 350 ms after it, waiting on the engine. The network hop to the GPU cost about 2 ms. So "make it faster" mostly means "make prefill smaller", and the cheapest prefill is the one you skip because the engine already has it cached.
The first turn was 4x slower, and it was our fault
When we moved our main voice model from Model B to Model A, the quality jump was obvious. So was the regression: the first turn of every call got almost four times slower. Later turns were fine.
A slow first turn followed by fast later turns is a strong hint that something isn't being cached, though compilation, queueing and prompt length can look similar, so it's worth checking. In our case Model B had the same miss all along. It was just fast enough to hide it. Model A is dense, a full prefill of a long prompt is expensive, and voice prompts are long: persona, rules, call flow, reference material.
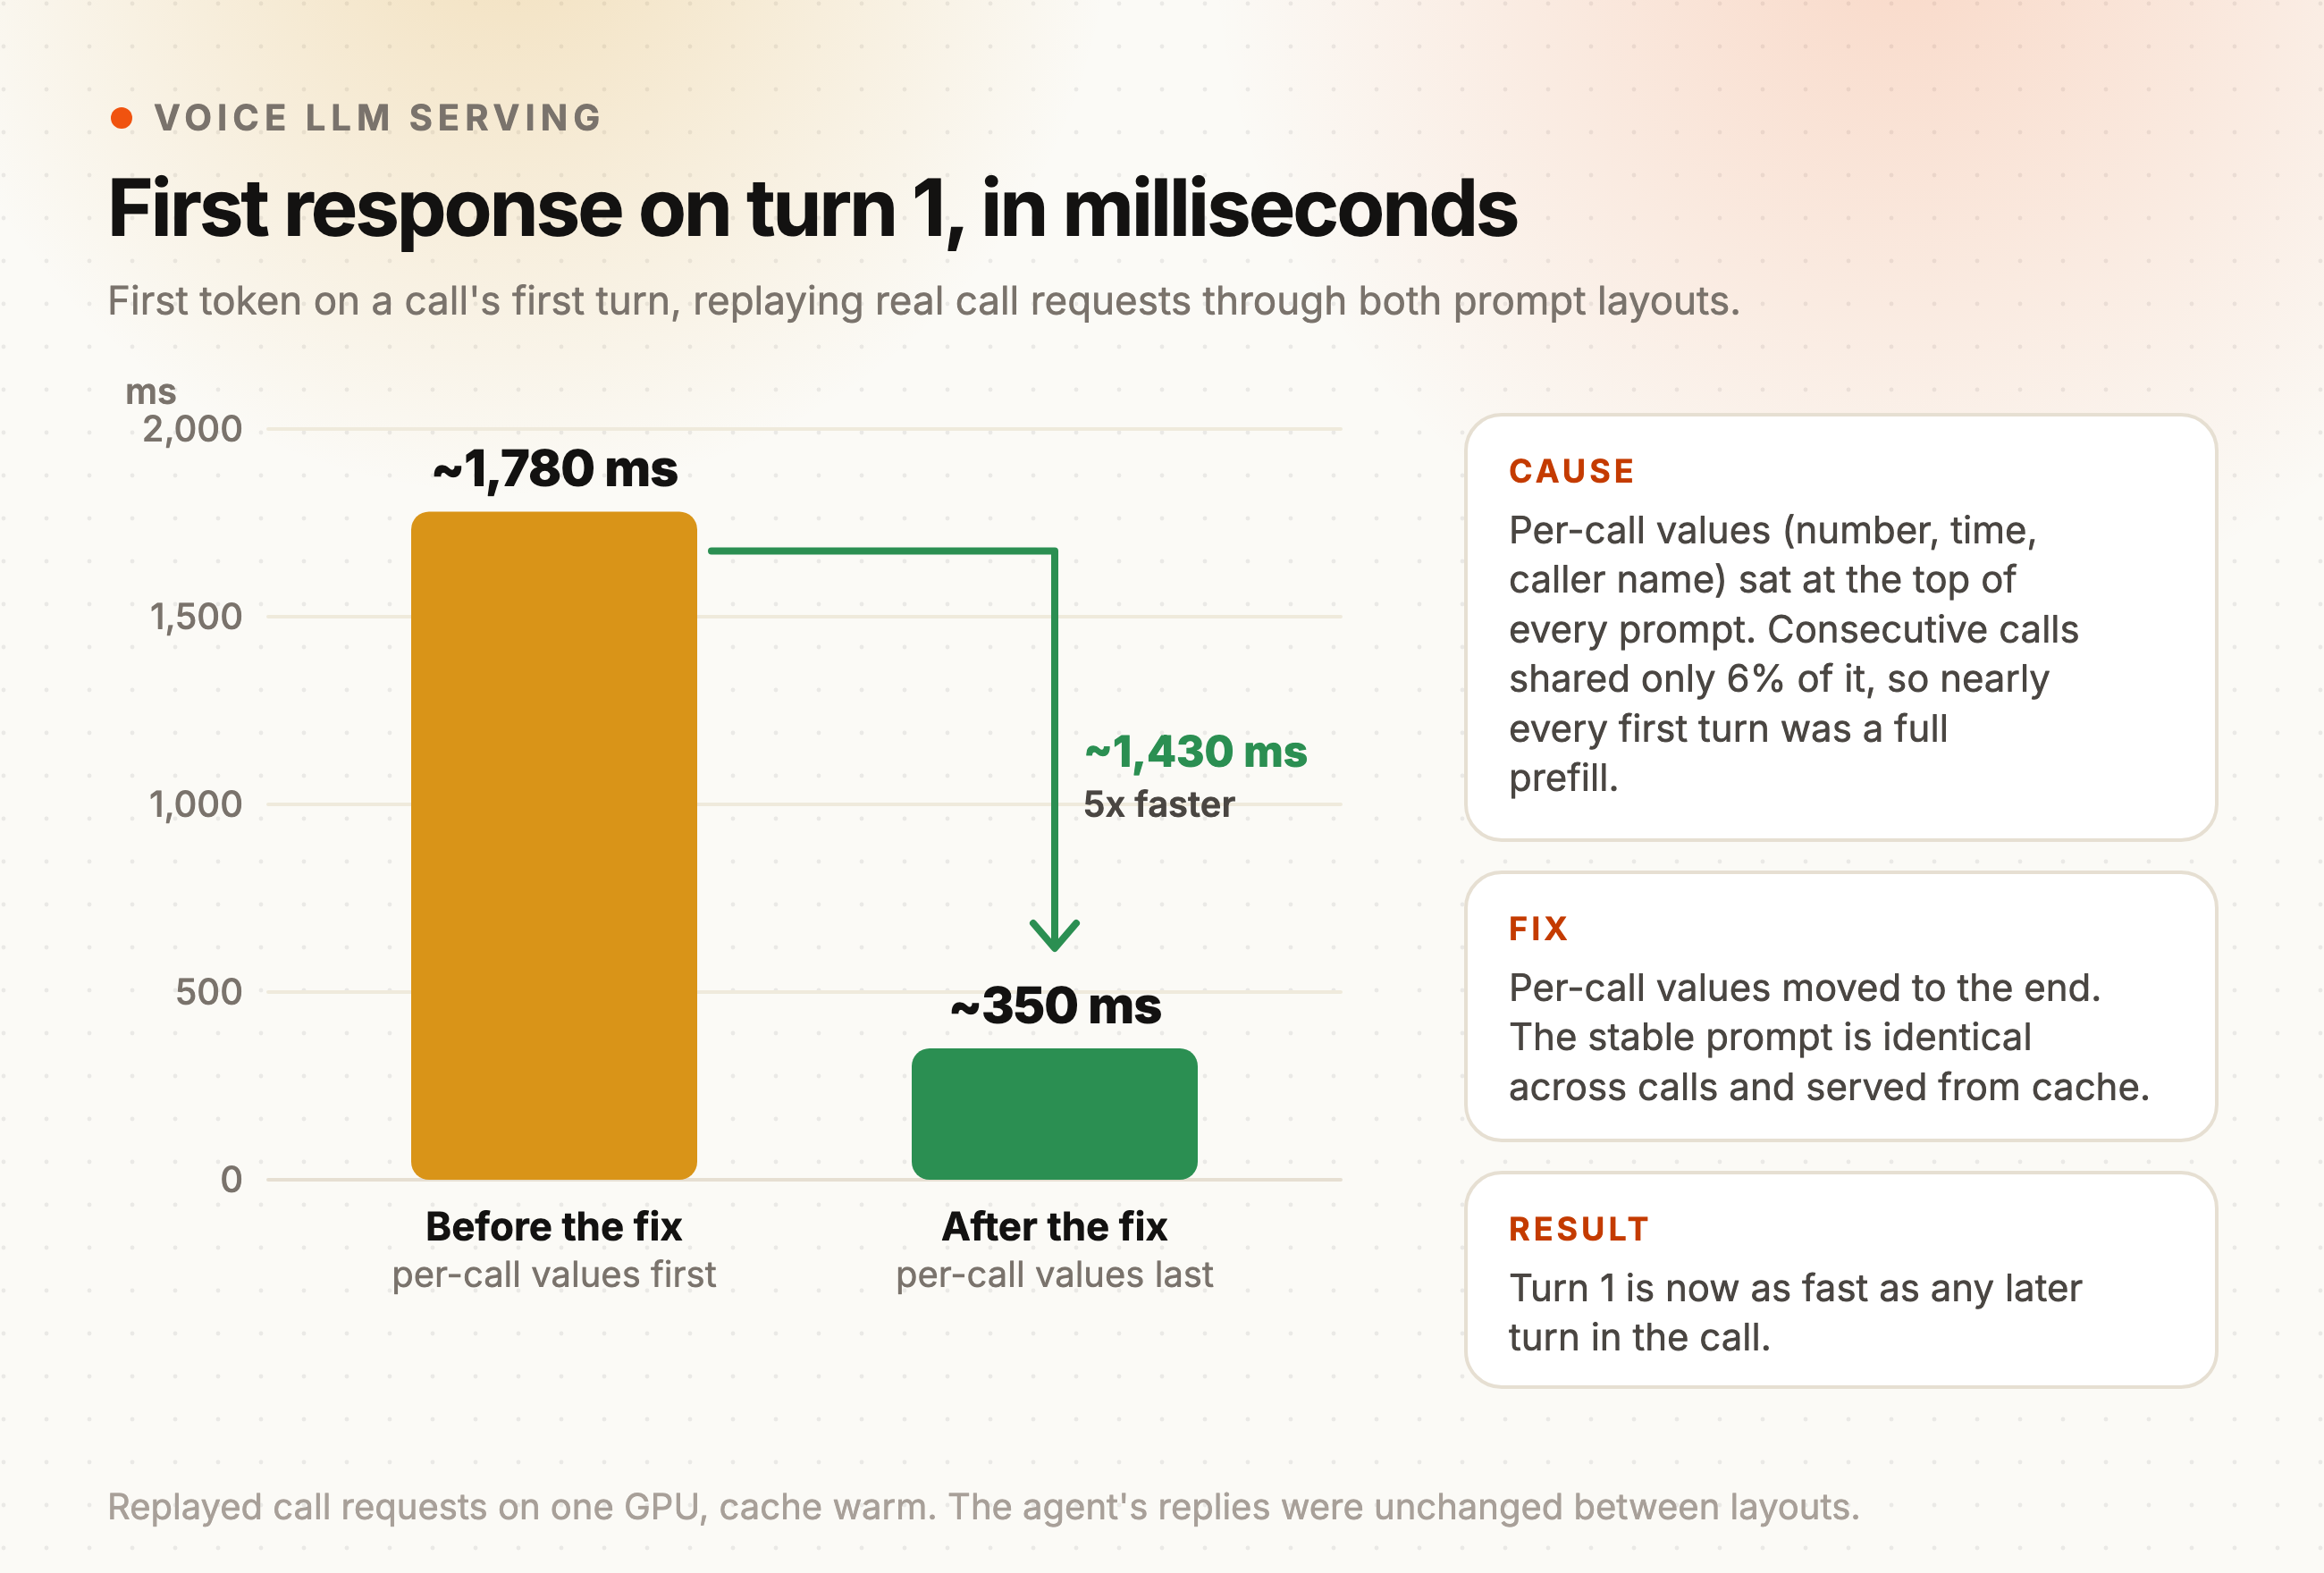
The cause turned out to be our own prompts. Every agent prompt opened with per-call values, such as the number dialed, the time and the caller's name. Inference engines only reuse work up to the first token that differs between two requests. Ours differed in the first few lines, so two consecutive calls to the same agent shared about 6% of their prompt. Nearly every first turn was a full prefill.
The fix is one rule: anything that changes per call goes at the end. We kept placeholders in the stable part of the prompt and moved the real values into a block at the very end. Then we replayed real call requests through both layouts. The agent's replies didn't change, and the first token on turn 1 dropped from about 1,780 ms to about 350 ms.
Once you know to look for it, you find this everywhere. A per-call value near the top, content inserted early, a small edit to something that was already in the context: each one quietly moves the point where the prefix stops matching.
It also matters for prewarming. At call setup we send the engine the stable prompt with a single output token, so turn 1 doesn't pay for a cold prefill. That only works if the warm-up request has exactly the same shape as the real one. Otherwise you are warming a prefix no real request will ever use.
Some models need more than one miss
This one surprised us. Some newer architectures keep a running state alongside the usual attention cache. On those, a cache hit needs more than matching text. It also needs a saved state at the point where the prefixes match, and the engine only saves that state after it has seen the same prefix miss. So after a deploy, the first call to an agent pays full price, the second sets up the state, and only the third gets the hit.
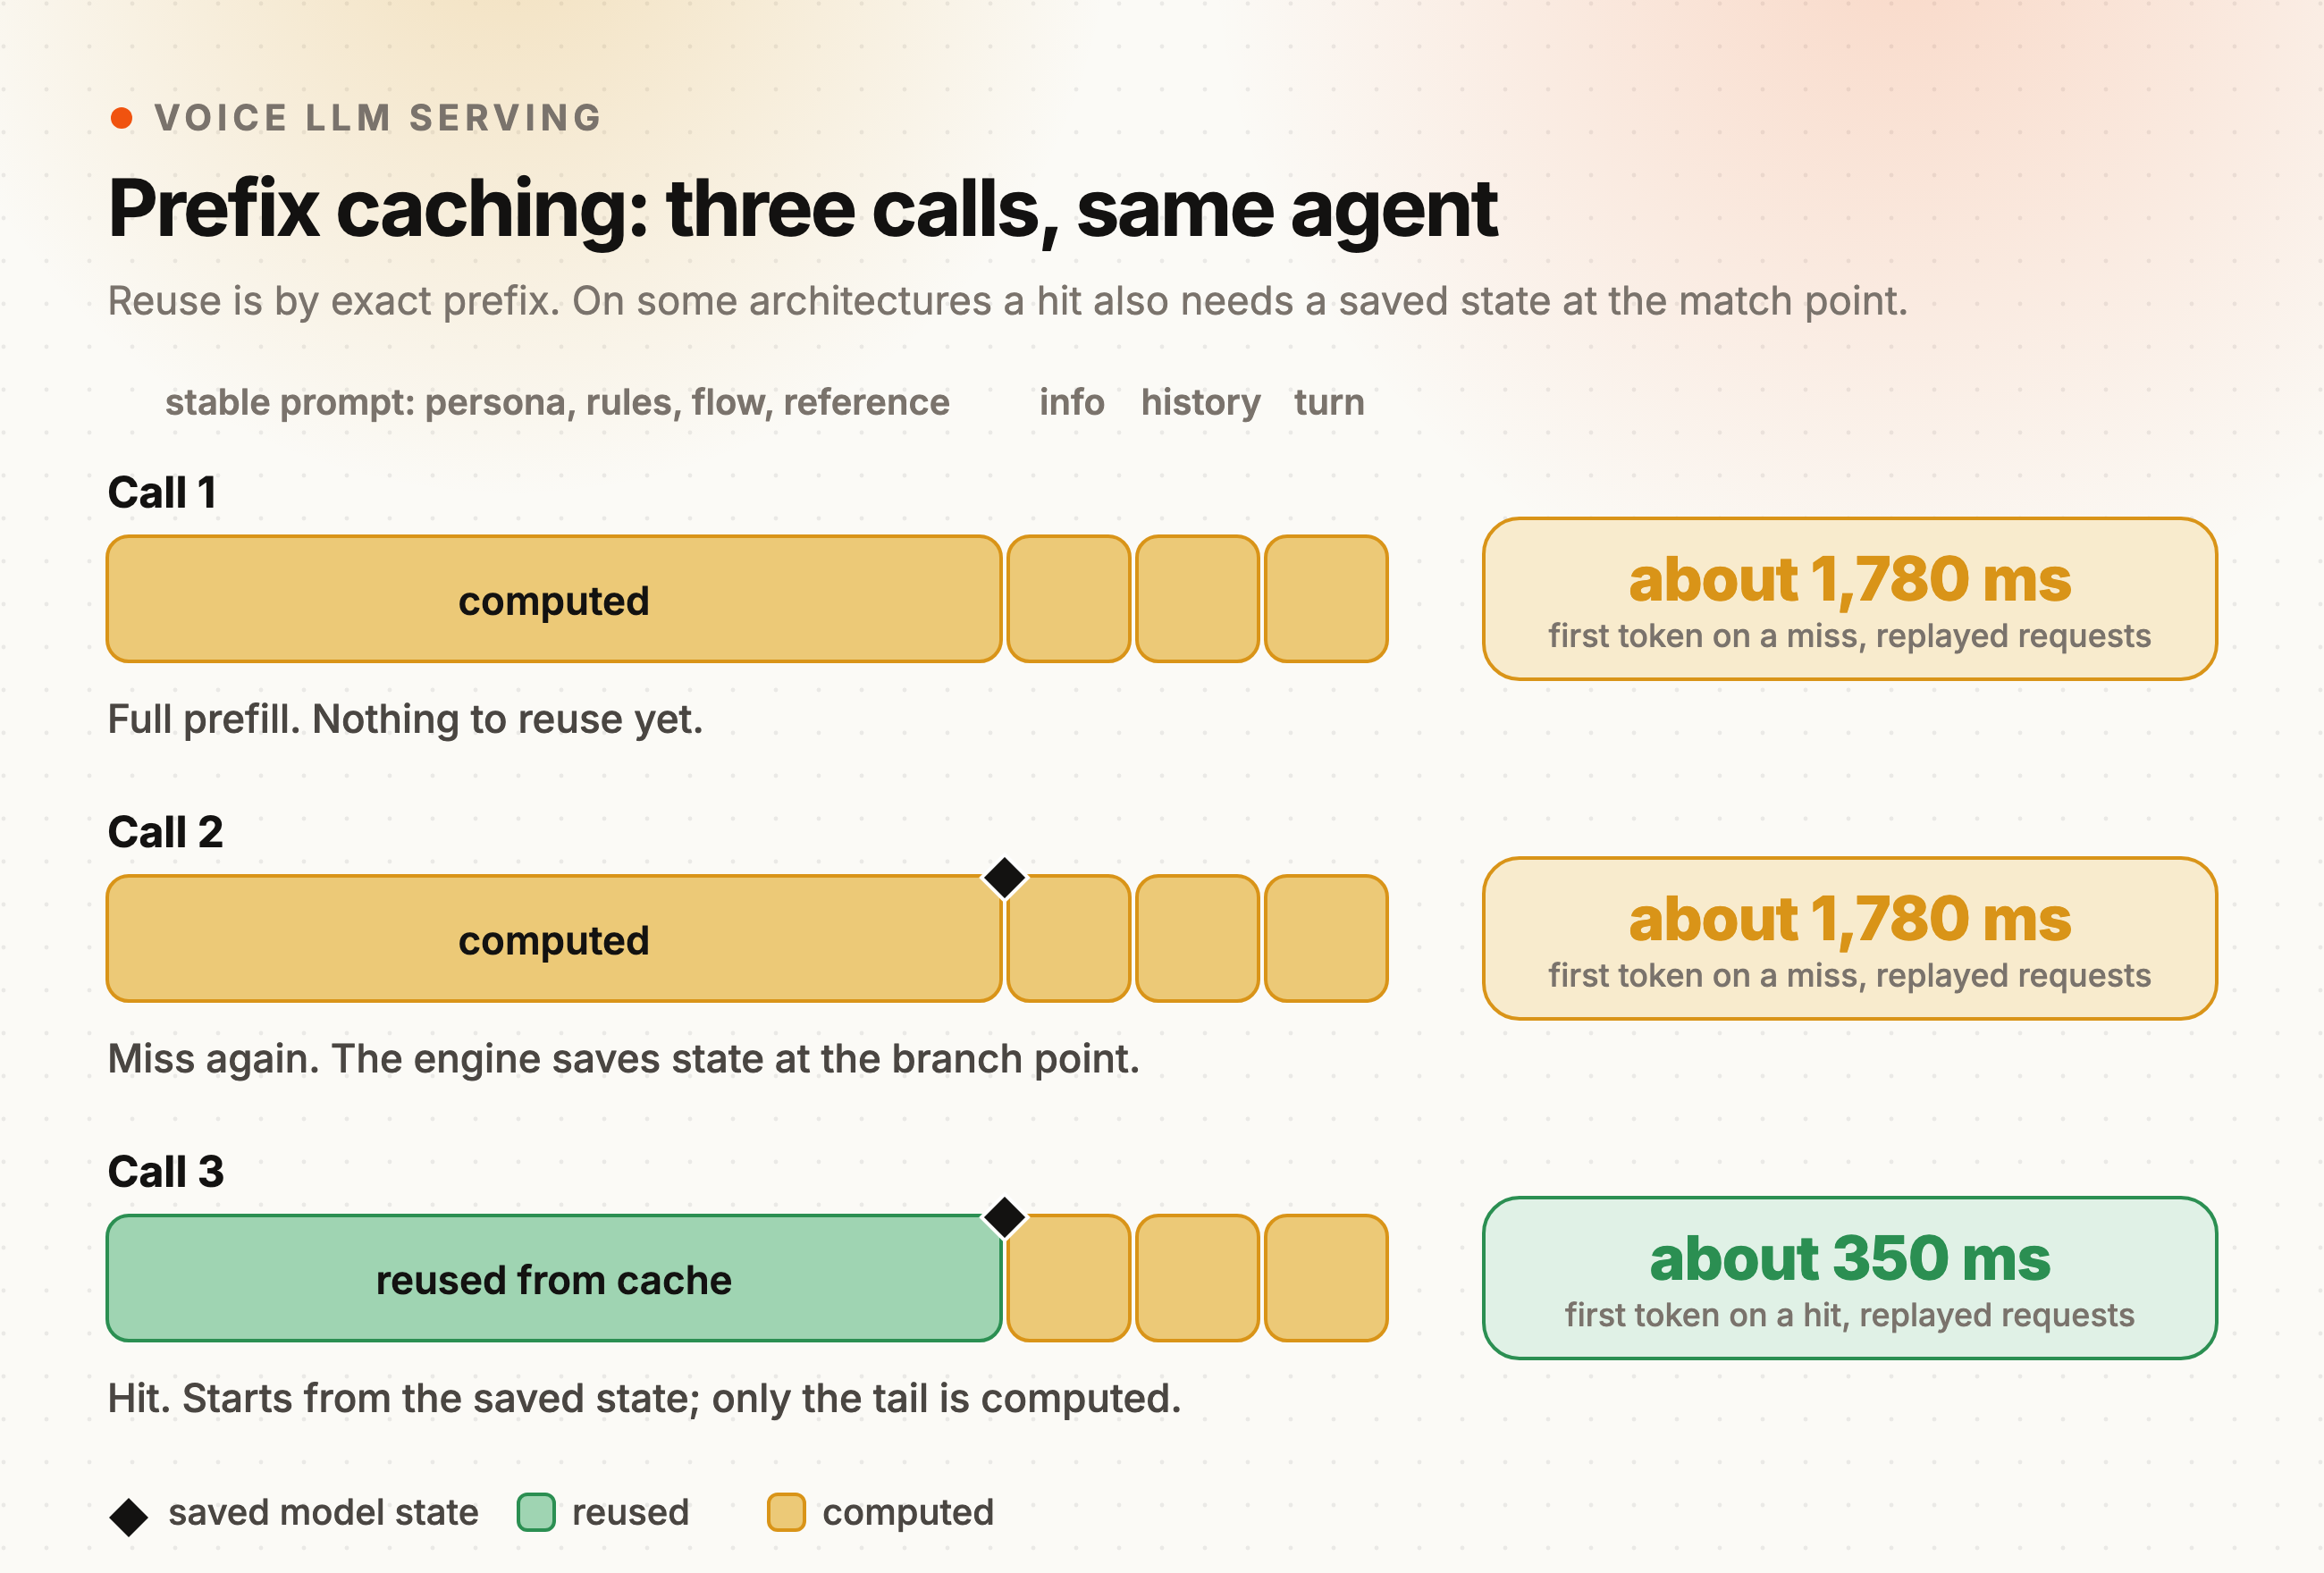
In practice this means warm-up has to send a few requests per prefix, not one. The layout rule itself is engine-independent, since SGLang's radix cache and vLLM's automatic prefix caching both reuse work by exact prefix. How each engine handles these architectures differs by version, so measure your own.
Measure the cache before you tune anything
SGLang logs new and cached tokens for every prefill, so the hit rate is a few lines of Python away:
import re

new = cached = 0
for line in open("server.log"):
    m = re.search(r"Prefill batch.*#new-token: (\d+), #cached-token: (\d+)", line)
    if m and int(m[1]) + int(m[2]) > 1000:  # skip health checks and warm-up pings
        new += int(m[1])
        cached += int(m[2])
print(f"cached share of prompt processing: {cached / (new + cached):.0%}")
The filter matters. Load balancer health checks produce a steady trickle of near-empty prefills, and if you count them, your hit rate looks far worse than it is.
Cache hit rate is your capacity
The slot count on a GPU is not its capacity. Our engine runs with 48 slots, which means it will run 48 requests at once. It does not mean one box can carry 48 calls. What actually fills a box is prefill. Every uncached prompt token has to be processed, and the engine does that at a roughly fixed rate, about 10,000 tokens per second on an H100 for this model.
To find out how many calls one box really carries, we built a simulator and made each simulated call as close to a real one as we could:
- each call sends everything a real call sends to the GPU, including function tools and background requests;
- prompts range from 3k to 21k tokens;
- calls run a median of 6 turns, with about 9 seconds between replies;
- calls end and new ones start continuously, so arrivals are staggered like real traffic;
- it runs on the GPU host itself, so the numbers are the engine's, with no network in them.
We ran it two ways. In the first, the context only ever grows from turn to turn. In the second, a block inside the prompt changes on half the turns, the kind of thing that happens when a system keeps updating what the model knows mid-call. That second variant lands at about 80% cached.
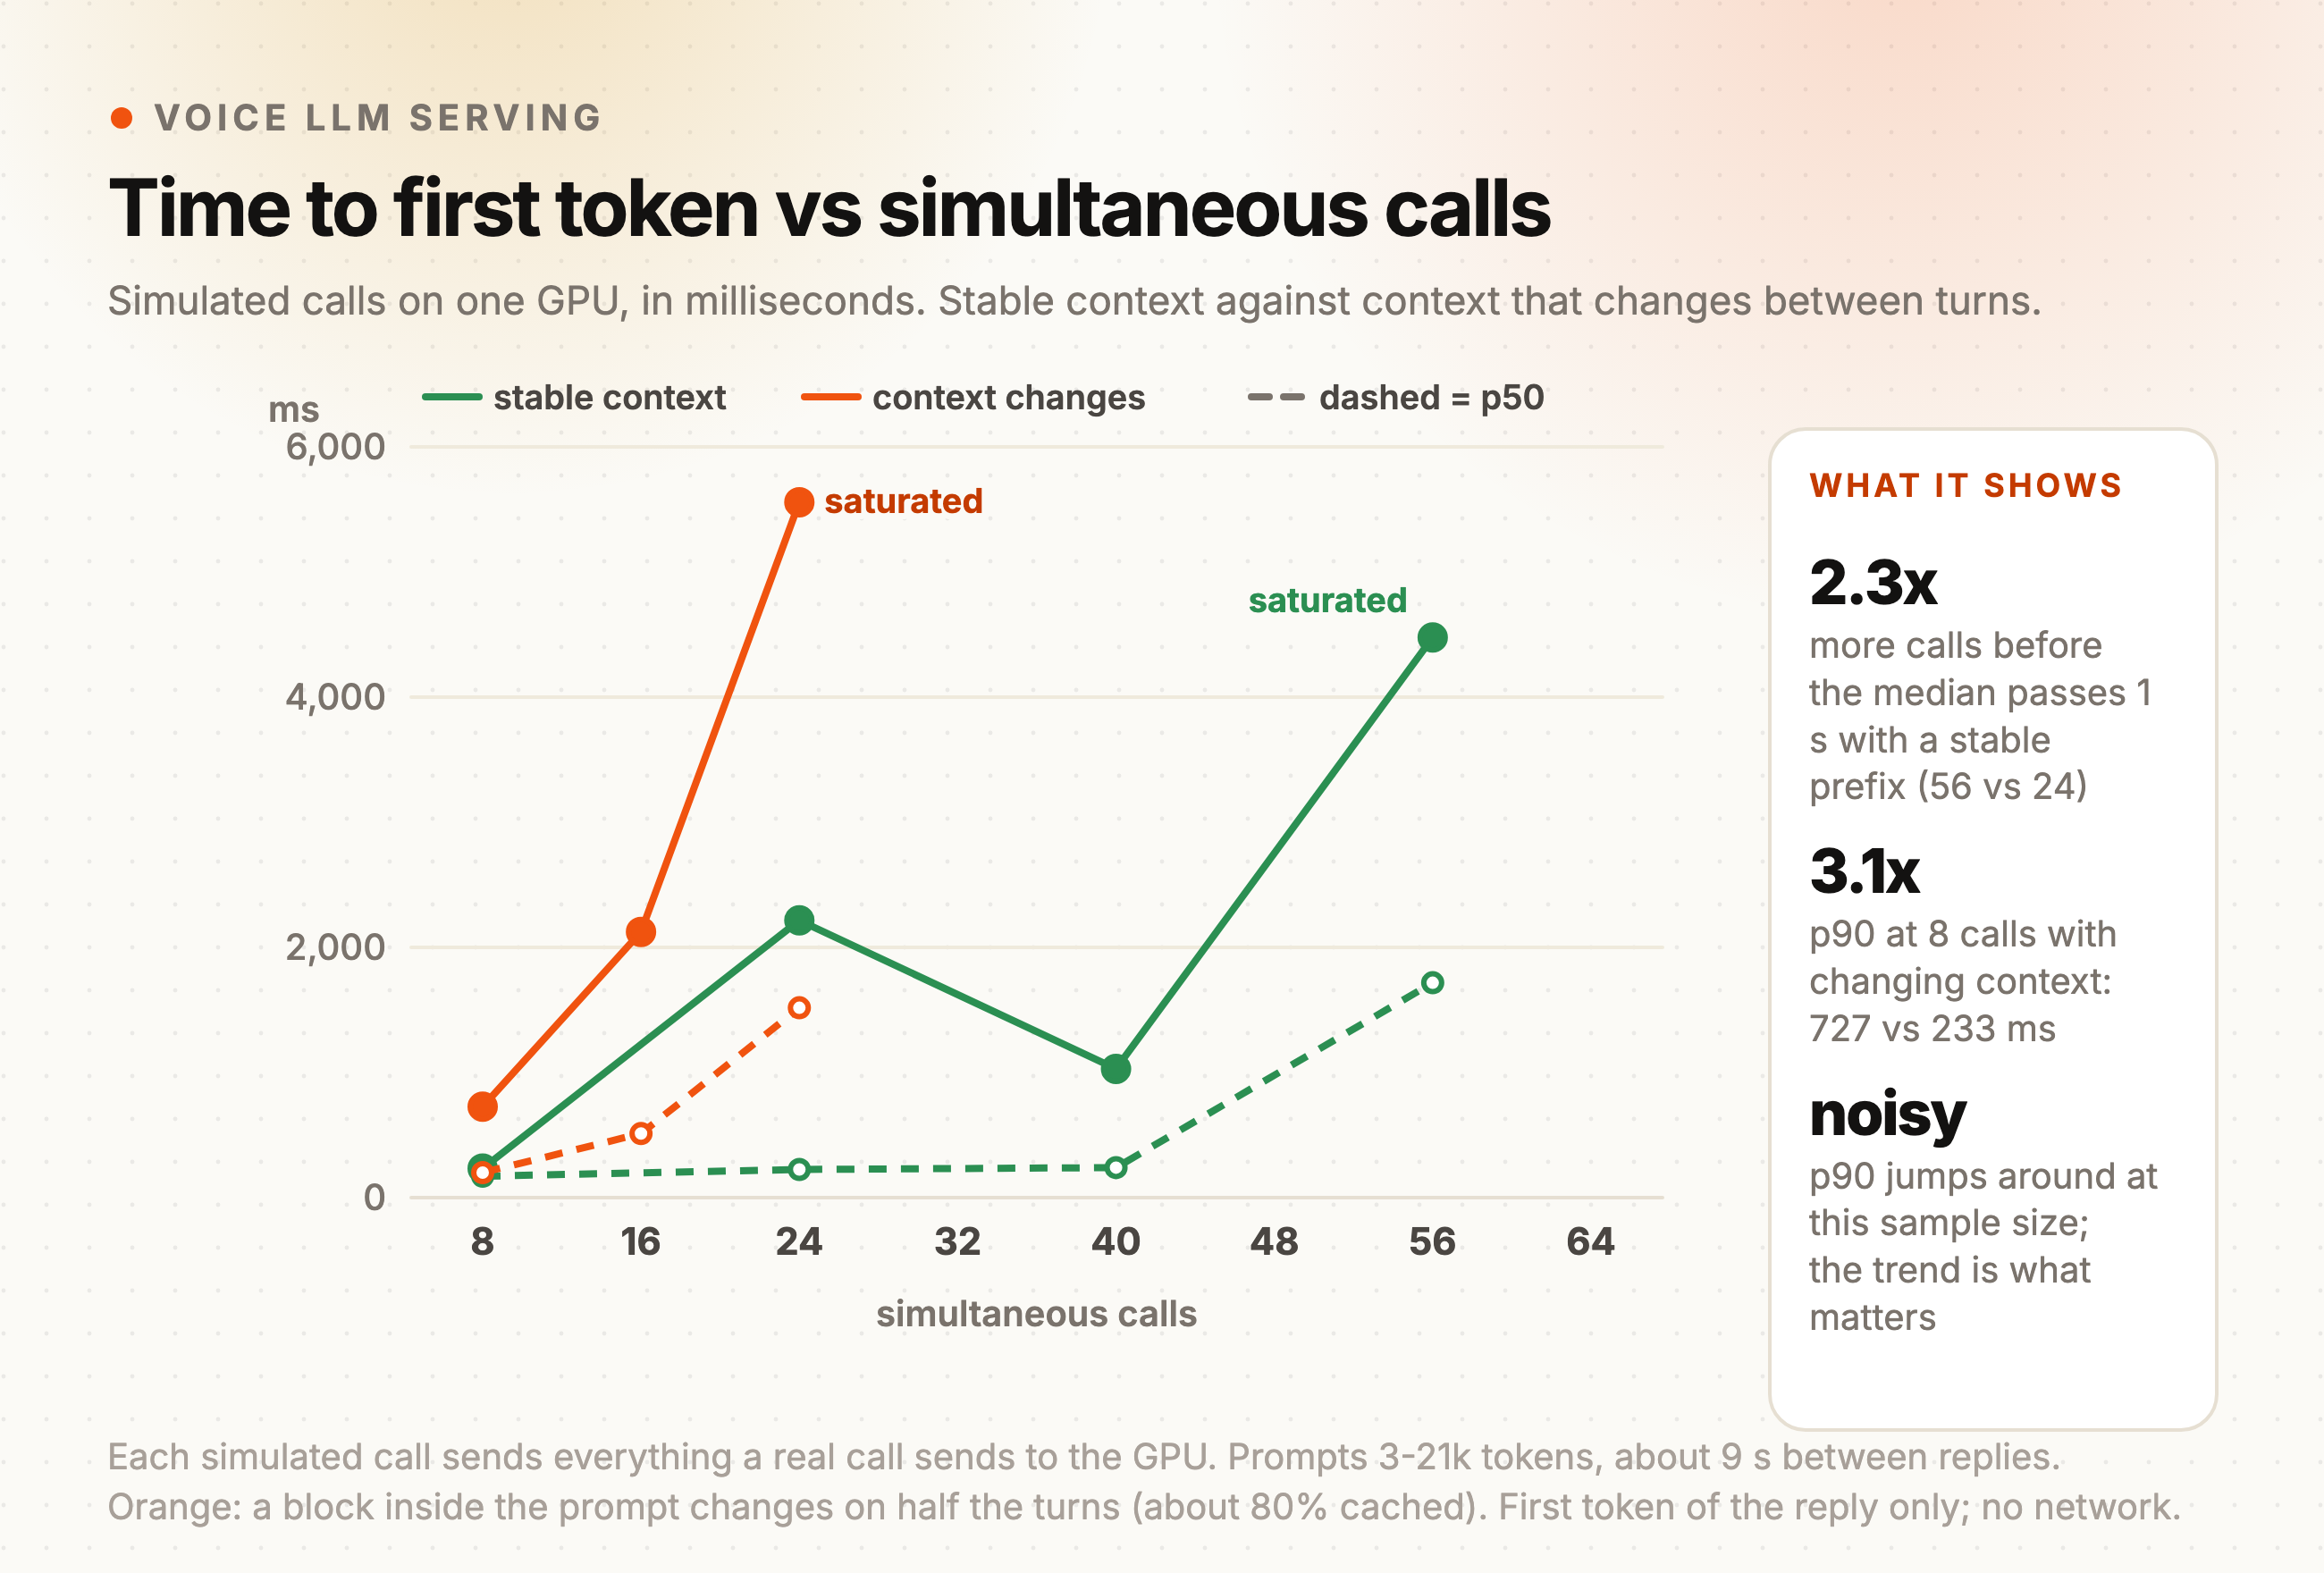
With a stable context, 92 to 98% of each prompt came from cache. The median first token stayed between 171 and 240 ms all the way to 40 simultaneous calls, and the box only saturated at 56.
With changing context, at about 80% cached, the median was 200 ms at 8 calls, 512 ms at 16 and 1.5 seconds at 24, where the box saturated. That is 2.3x fewer calls on the same hardware, for what looks on paper like a modest drop in hit rate.
It makes more sense once you stop plotting against calls and plot against the work the engine is being asked to do:
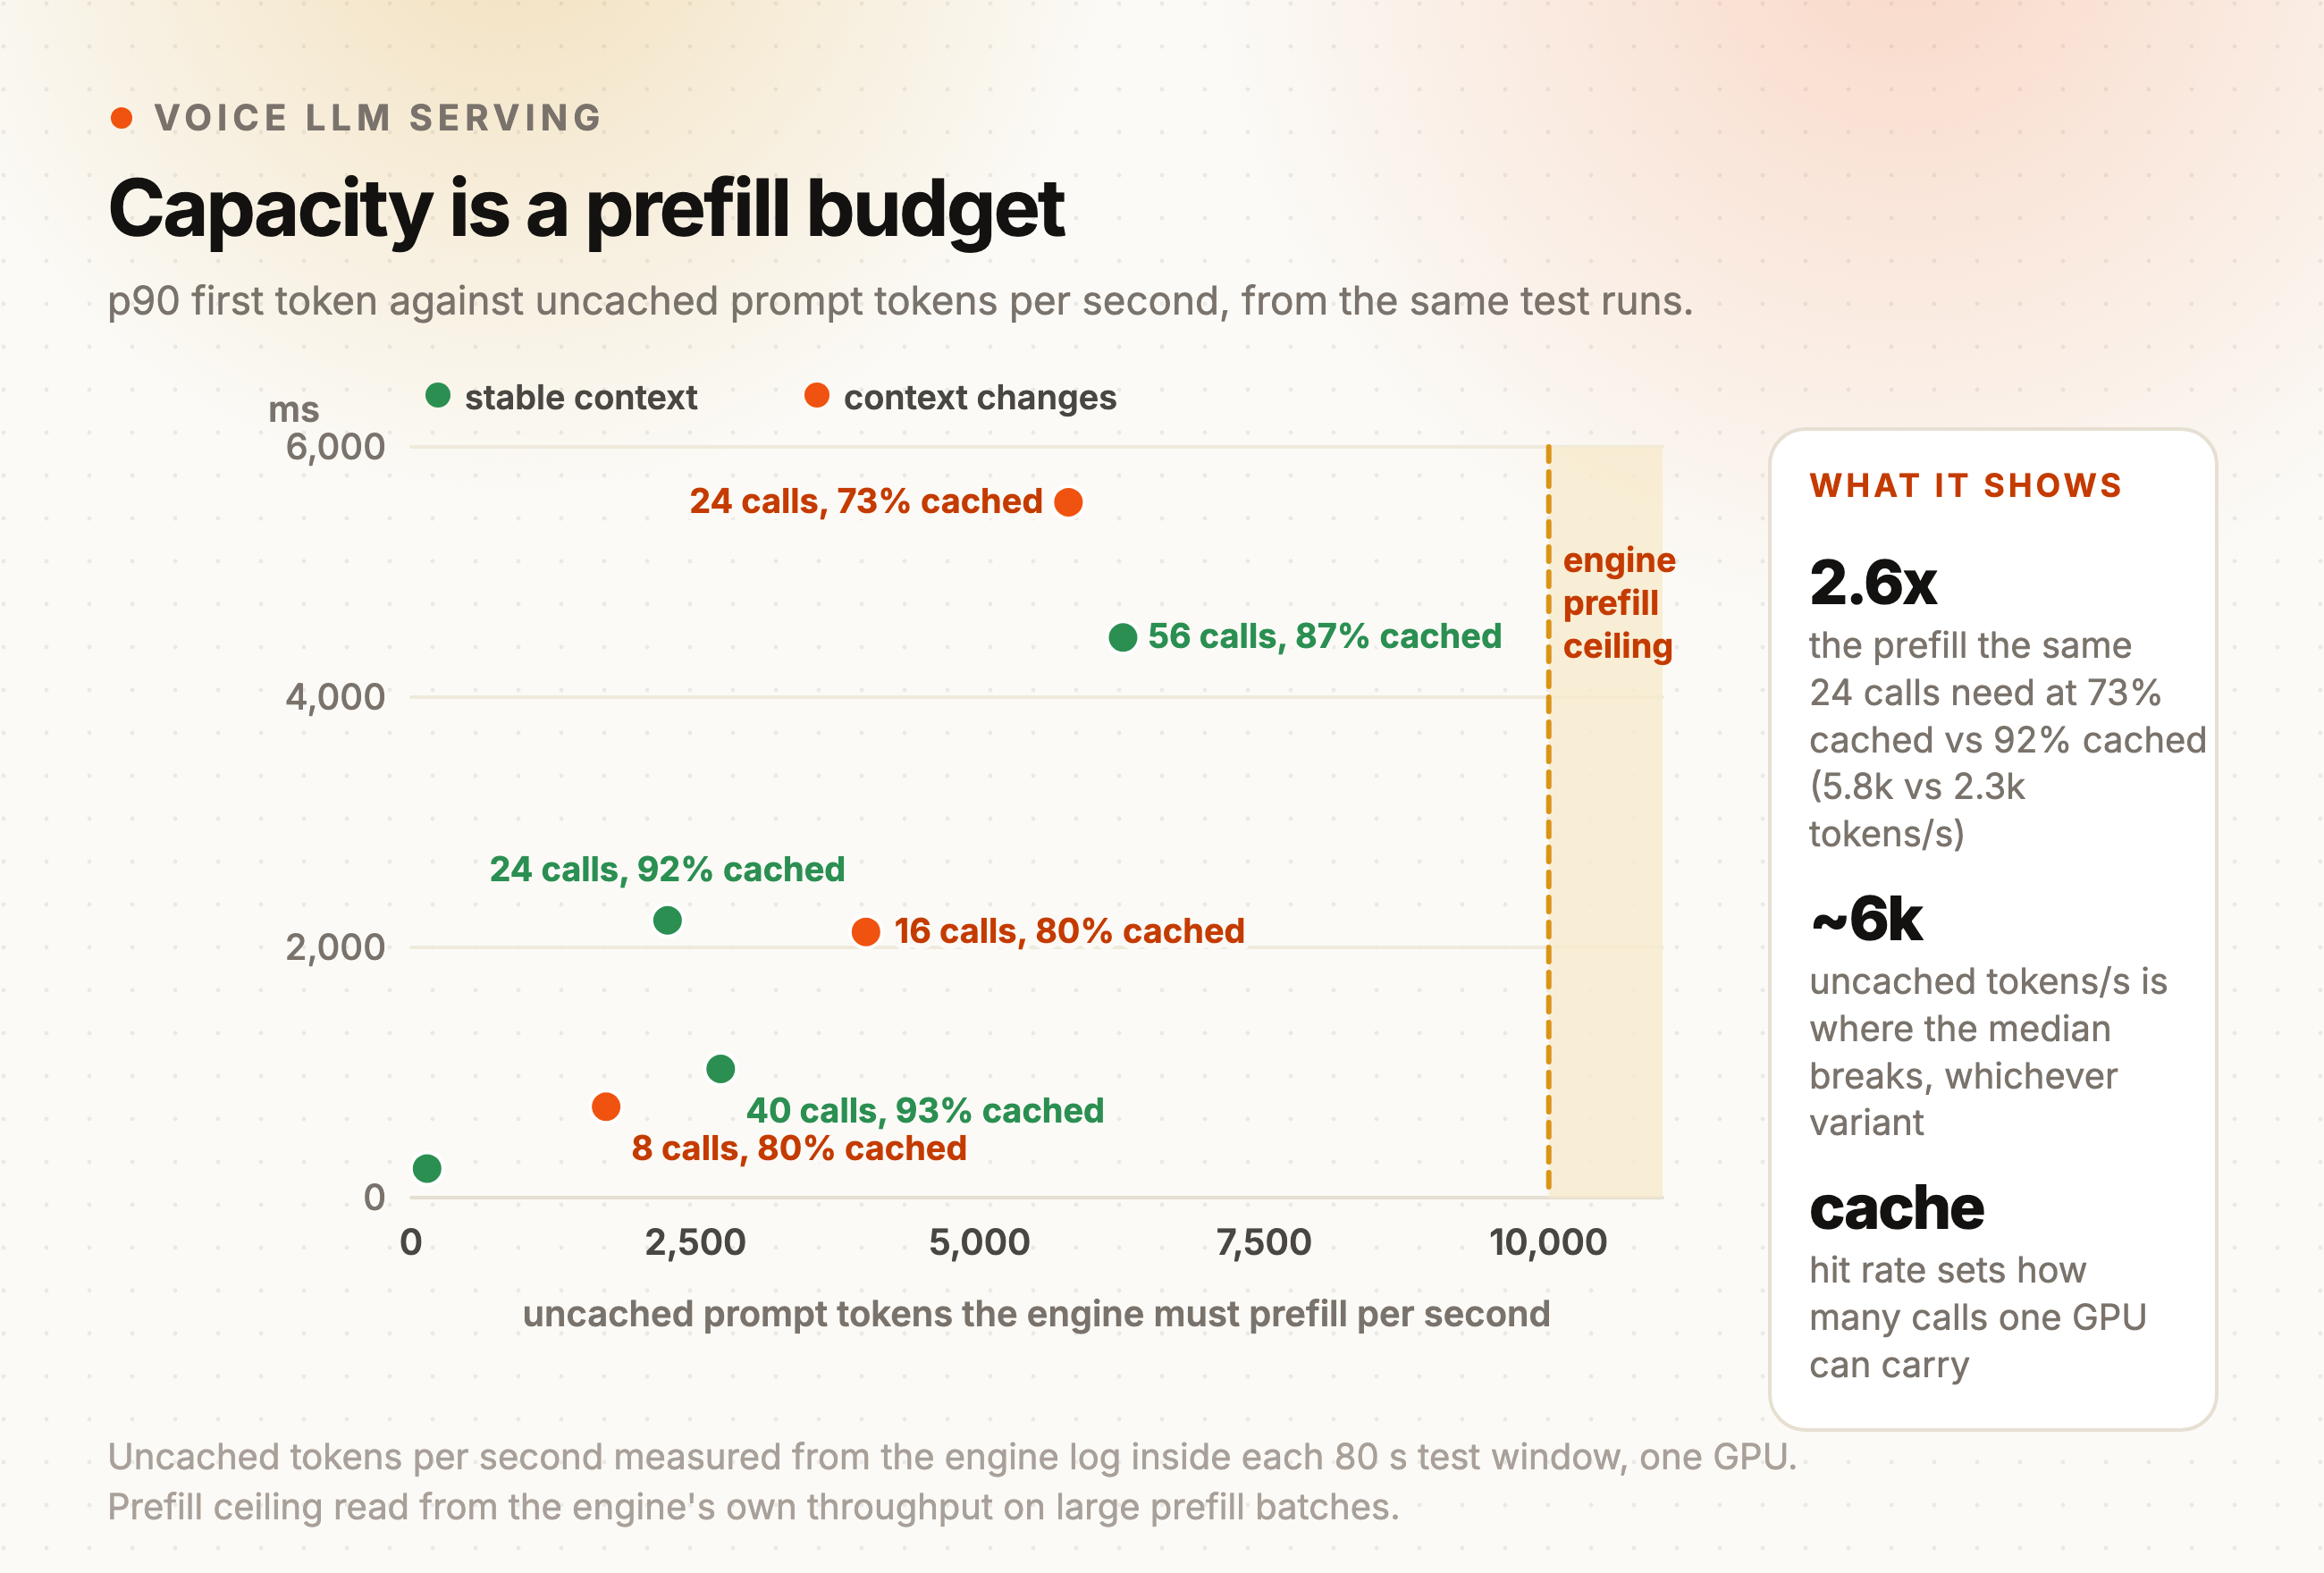
Both variants land on the same curve. At 24 calls, the changing-context run needed about 5.8k uncached tokens per second and the stable run about 2.3k. That is 2.6x the prefill for exactly the same calls. Either way, the median broke at around 6k uncached tokens per second, roughly 60% of the prefill ceiling.
So we now think of capacity as a prefill budget, and of the hit rate as what decides how fast it gets spent. In our tests, the runs that held up were the ones caching 90% or more of the prompt. Your exact threshold will depend on your prompts and your mix, but the shape of the curve is worth knowing before you buy another GPU.
The more agents share a GPU, the worse it caches
A GPU's cache holds the prefixes of whichever agents it serves. Put more distinct agent prompts on one GPU and they start competing for the same memory: more prefixes, more saved states, and more first turns that arrive cold. We wanted to know what that costs in practice.
So we ran the same simulated calls on one GPU twice: once with 12 different agent prompts, and once with 3 agents of the same average prompt size. Everything else stayed the same, including the load, the call shape and the mix of requests.
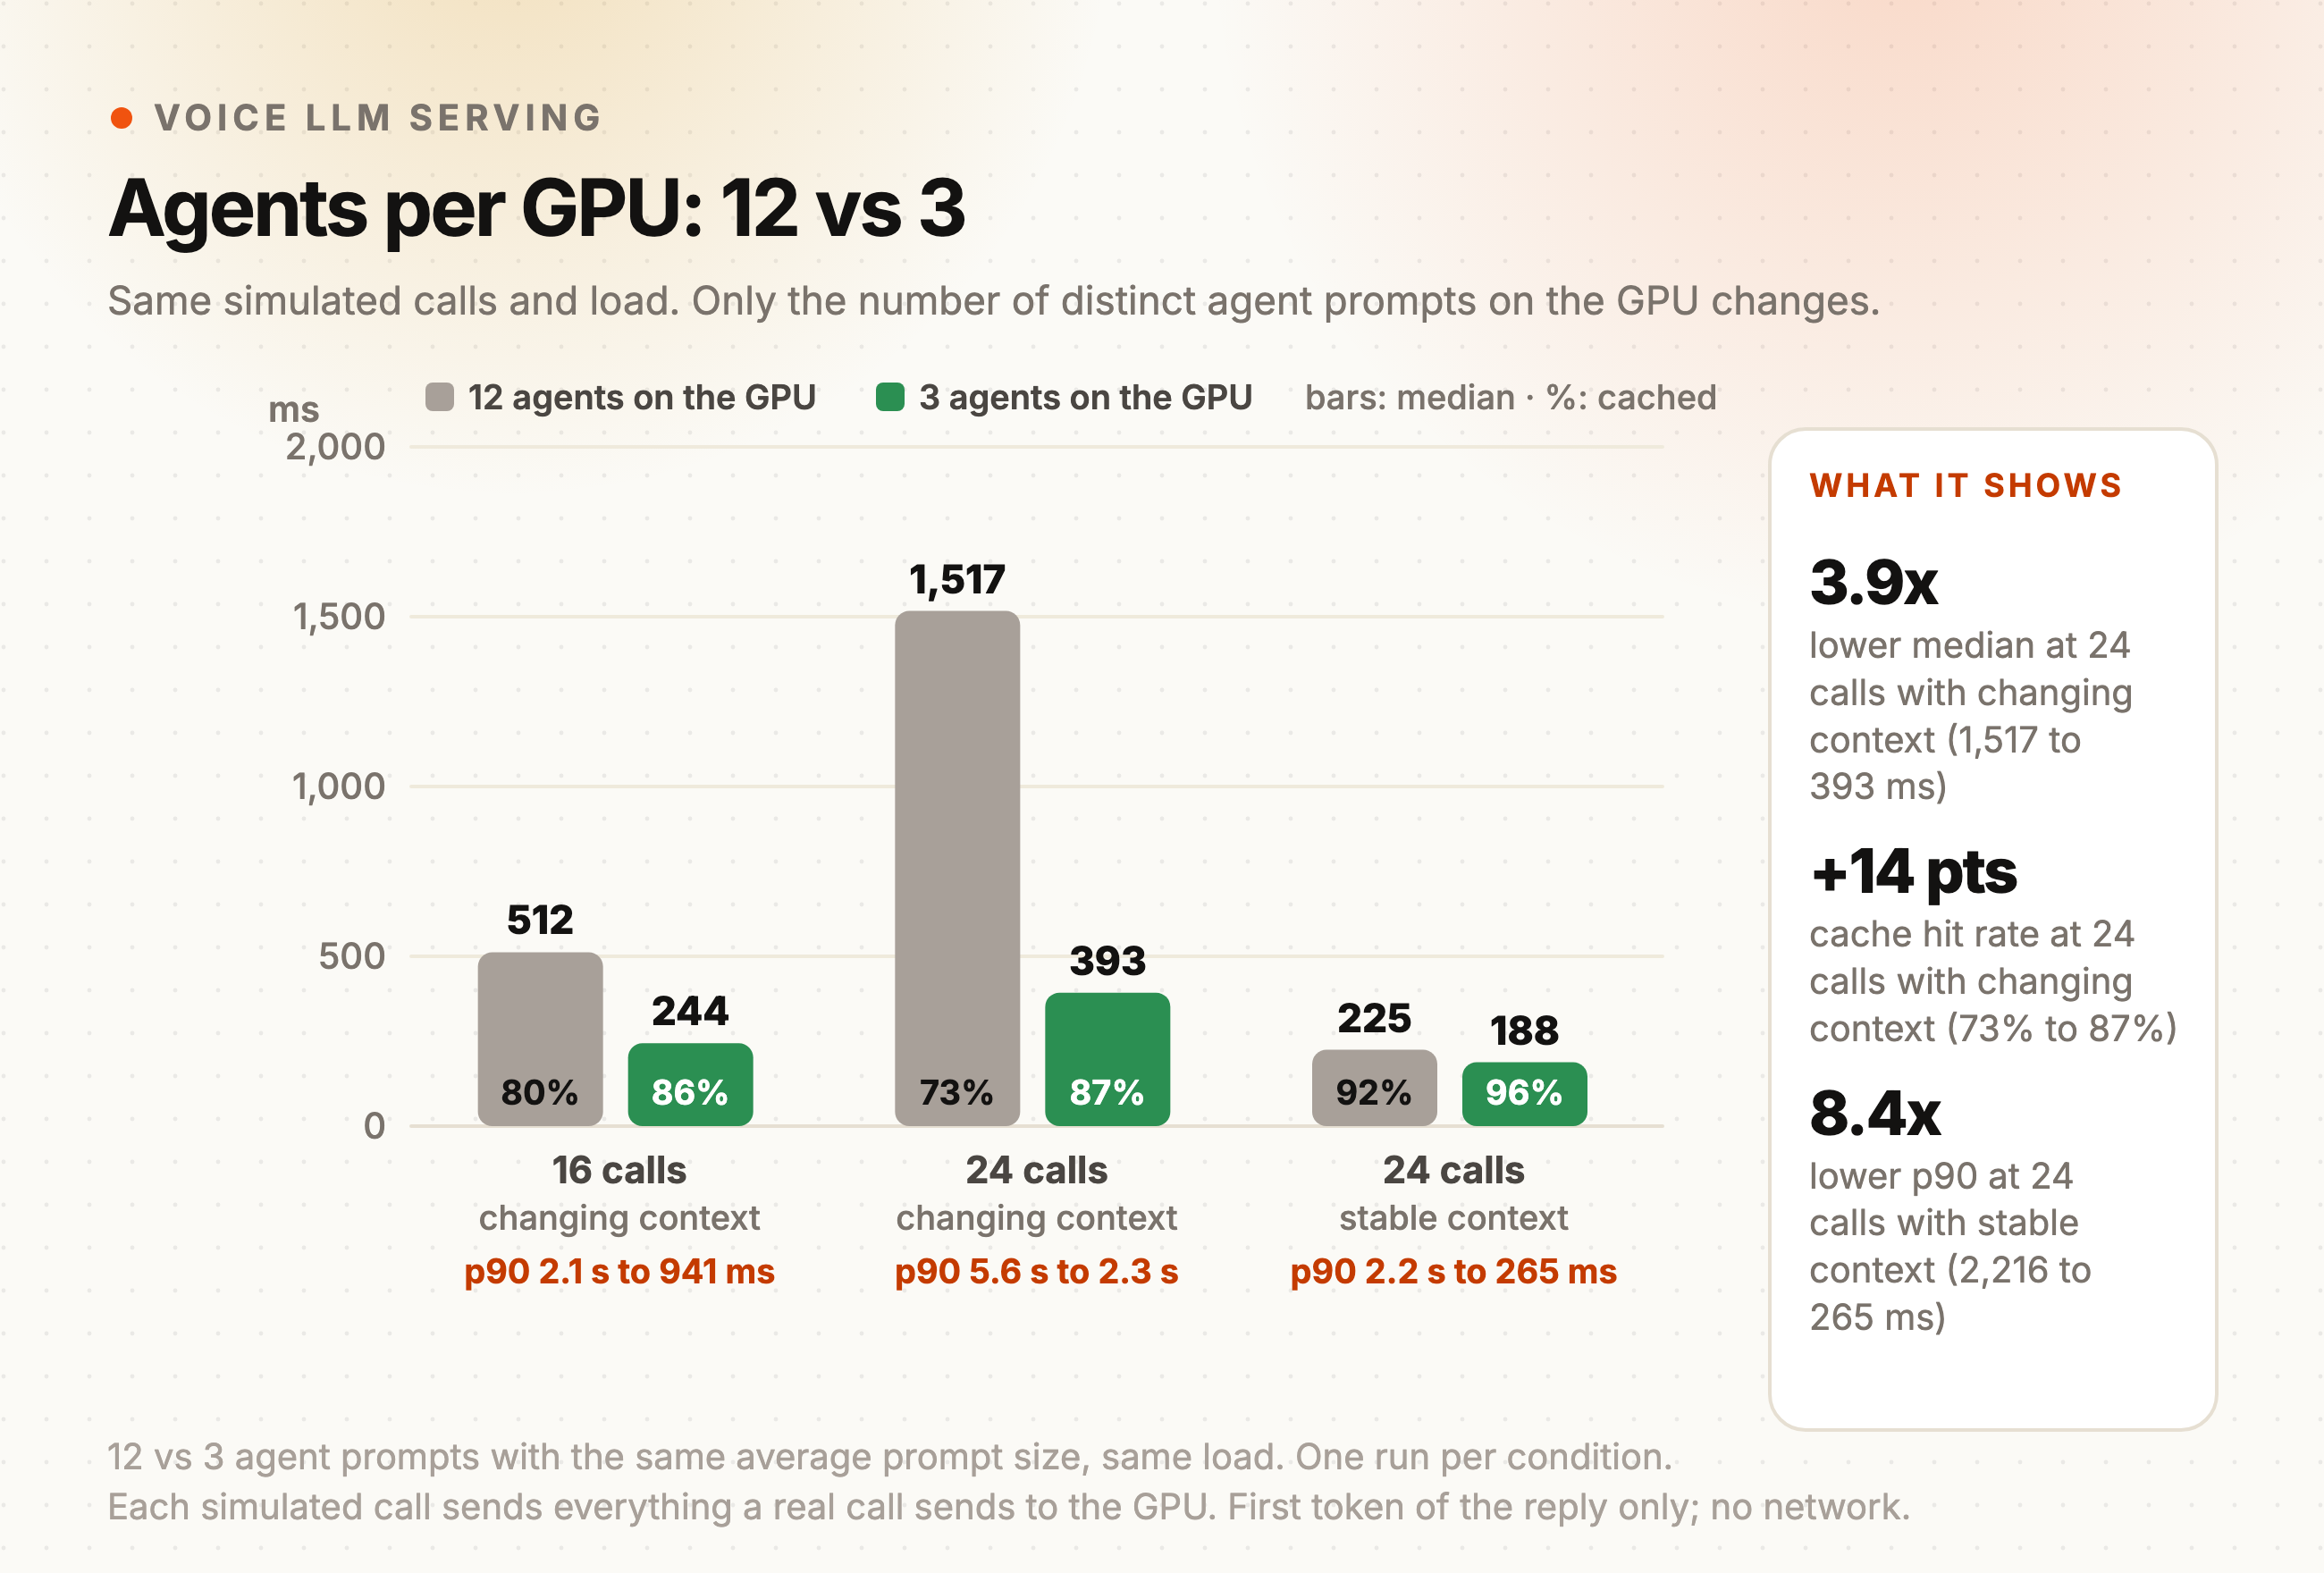
At 24 calls with changing context, going from 12 agents to 3 raised the hit rate from 73% to 87% and cut the median from 1,517 to 393 ms, a 3.9x drop. The 12-agent run was saturated and the 3-agent run wasn't close.
At 16 calls with changing context, the median went from 512 to 244 ms and p90 from 2.1 seconds to 941 ms.
With stable context at 24 calls, the median barely moved (225 to 188 ms), but p90 collapsed from 2.2 seconds to 265 ms. Fewer agents means fewer cold first turns, and cold first turns are what make up the tail.
Each of these ran once, so read the p90s as indicative rather than exact. But the direction was the same in every pair, and it is the same mechanism as before: a higher hit rate means less prefill per second, which keeps the engine further from its ceiling.
What we'd recommend
If you serve many agents across more than one GPU, round-robin is the wrong default. It spreads every agent's prefix across every GPU, so each cache tries to hold everything and keeps little of it warm. Do this instead:
- Route by prompt prefix. Hash each request on its agent or prompt prefix and send it to the same GPU every time. That GPU already holds the prefix and its saved states, so the request starts warm.
- Keep each GPU's set of agents small. As the test shows, fewer distinct prefixes per GPU means a higher hit rate at the same load.
- Give a busy agent its own GPUs. When one agent outgrows a GPU, give it a dedicated group and balance inside that group, instead of letting it spill across the whole fleet.
- Spill before you queue. Let a hot GPU hand requests to the next GPU in that agent's group before it starts building a queue. A slightly colder cache costs less than waiting in line.
- Keep the mapping stable. Reshuffling agents on every deploy throws away warm caches. When you do move an agent, warm the new GPU first.
- Watch the hit rate per GPU. Alert when a GPU drops below 90%. It is the earliest warning you'll get that a box is about to run out of prefill.
You don't have to build this from scratch. SGLang's Model Gateway routes by cached prefix by default, and vLLM's production stack has prefix-aware routing.
The engine underneath
None of the above helps if the engine itself is sized badly, and on a model with a running state there are more ways to get that wrong.
Memory: two pools, one budget
A model like ours needs two pools of GPU memory: the attention (KV) cache, and a pool of saved states for the requests it is running. Giving more to one takes from the other, and the total is fixed. We swept five launch configurations on a dedicated 80 GB GPU to see where the trade-offs land:
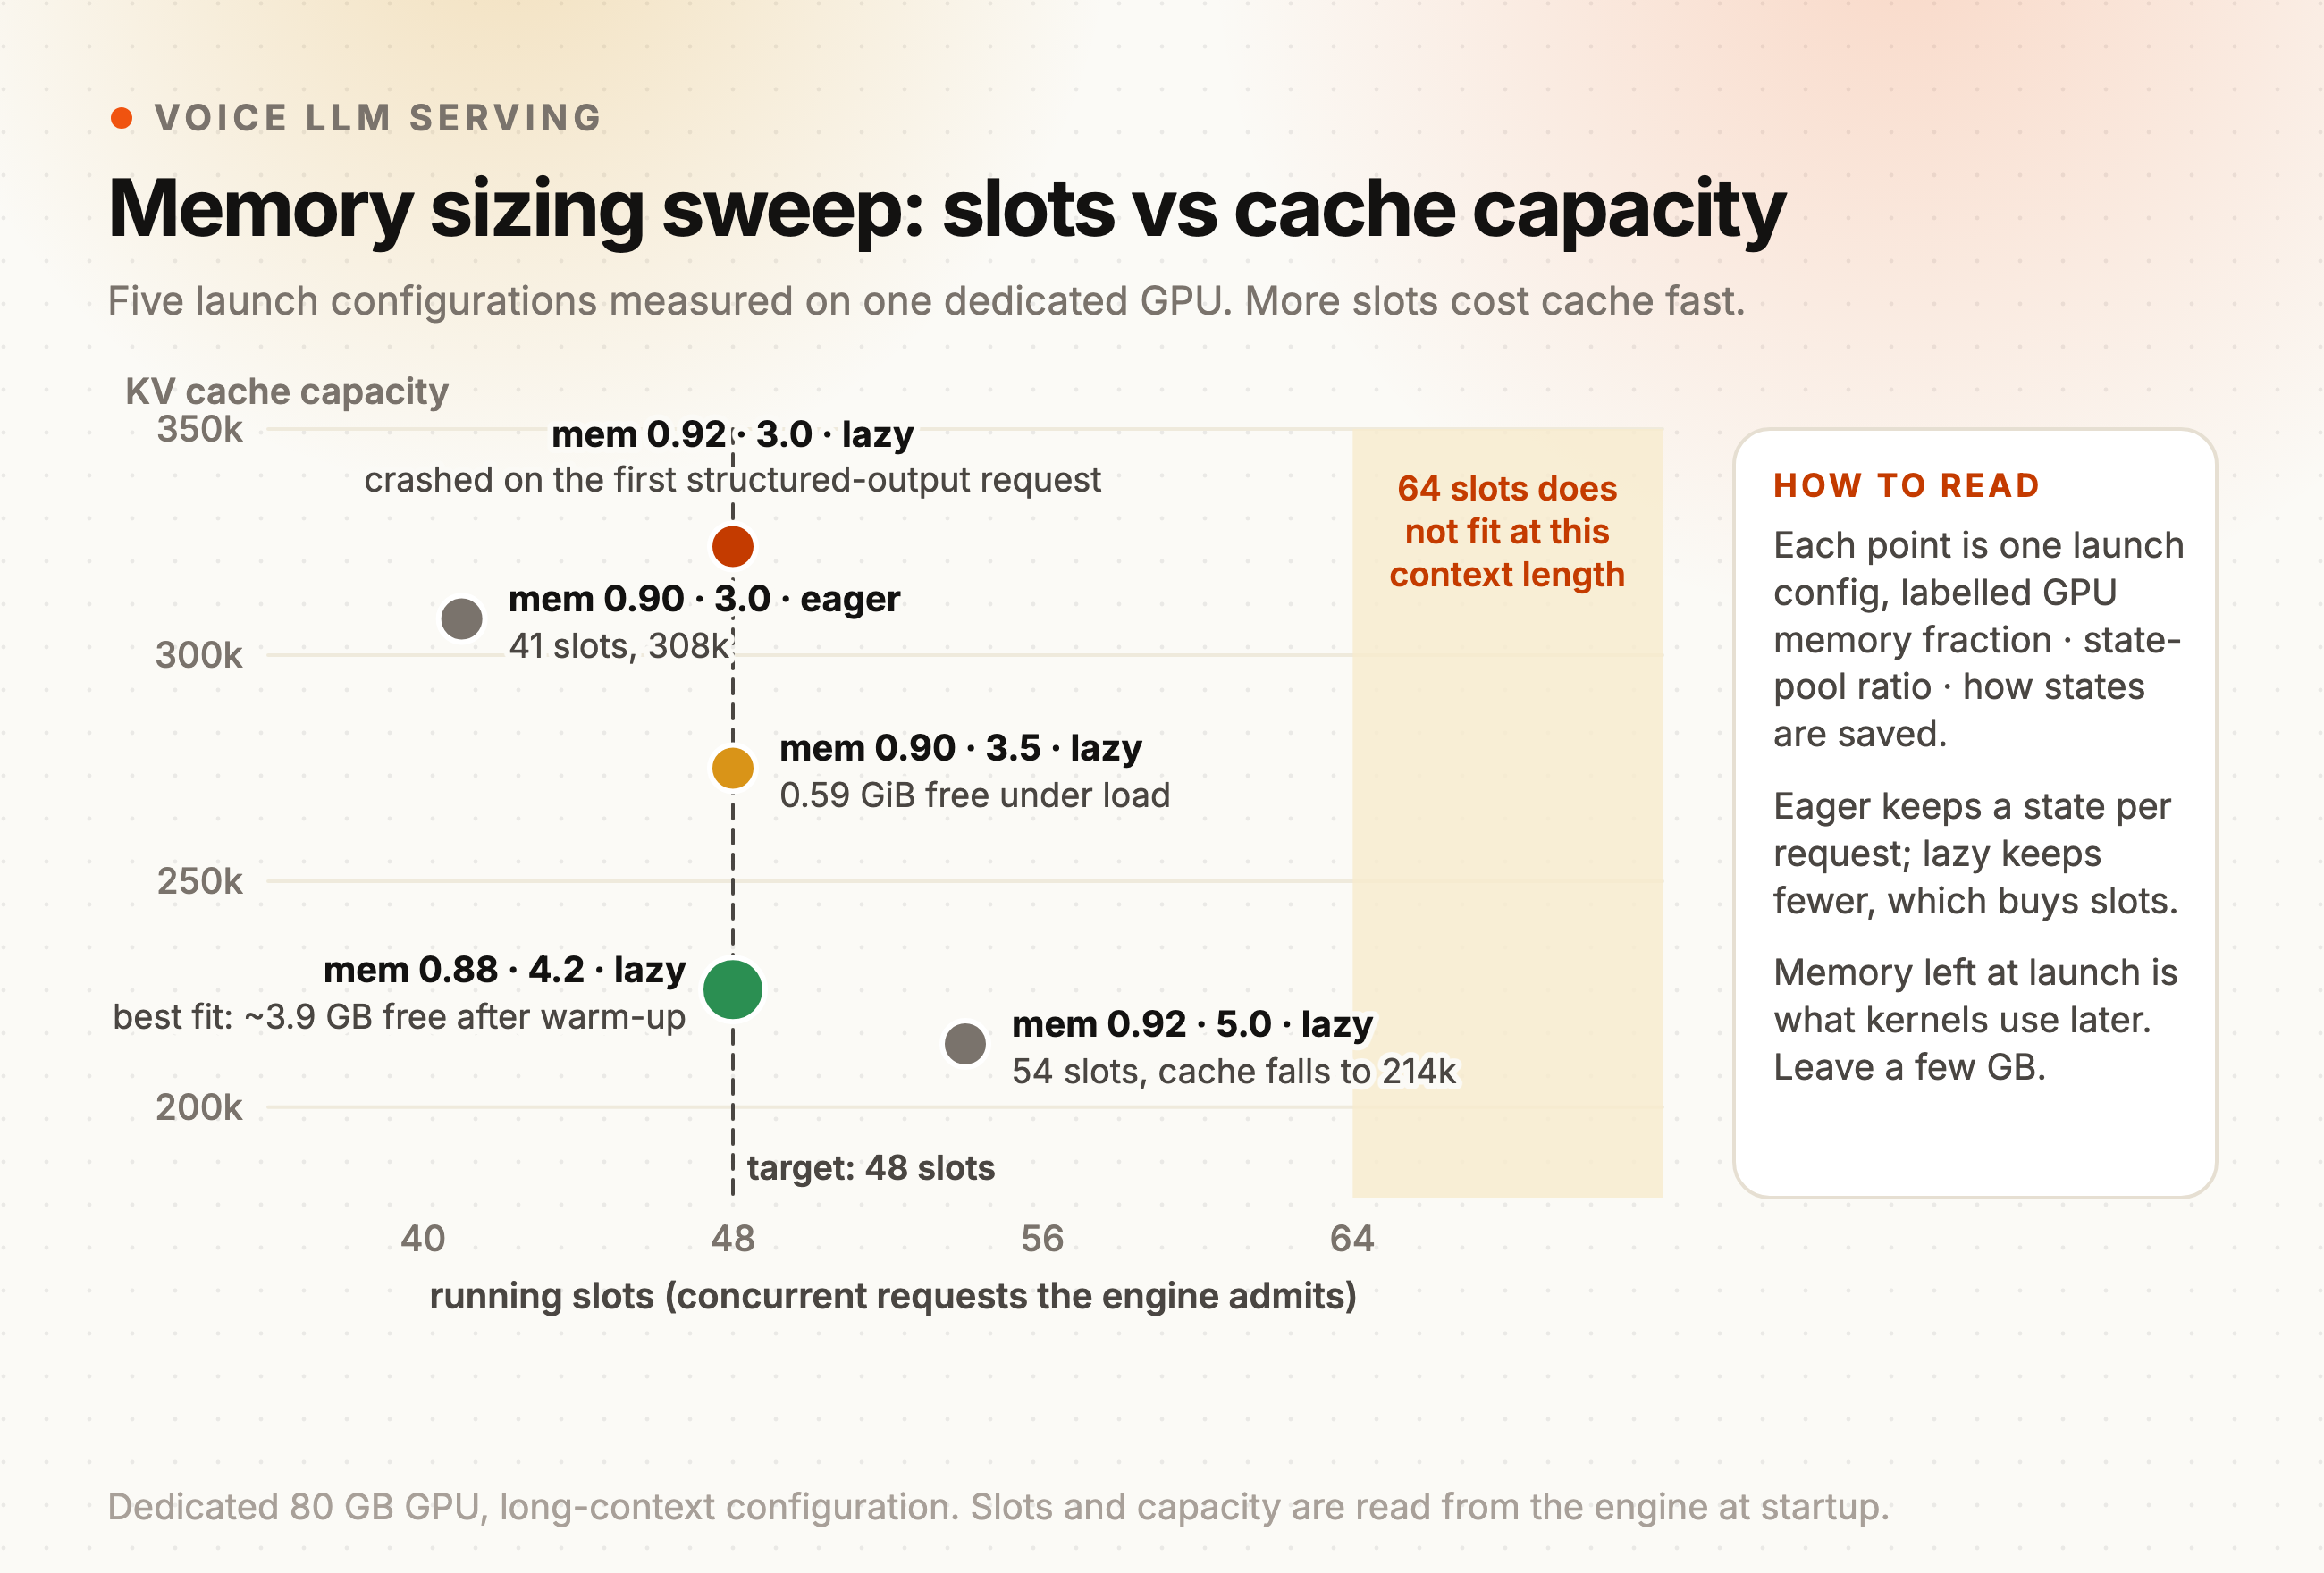
A few things stood out. First, extra slots cost cache quickly. At the same 0.92 memory fraction, going from 48 to 54 slots took the KV cache from 324k tokens to 214k, and 64 slots didn't fit at our context length at all.
Second, memory you leave free at launch isn't actually free. Several kernels (sampling, grammar-constrained decoding, communication buffers) only load the first time they're used, outside the pre-allocated pool. At a 0.92 memory fraction the server started cleanly and then crashed on its first structured-output request. At 0.90 it ran, with 0.59 GiB free under load. The best fit in our tests was 0.88 with lazy state saving: 48 slots, 226k tokens of cache, and about 3.9 GB free after warm-up. The lesson is that a clean start proves nothing.
Third, the default split was bad for conversations. With default sizing, the cache evicted conversation prefixes under load and the hit rate in a load test was only 44%. Retuning the split, with an FP8 KV cache, raised it to 70%.
Speculative decoding
A dense model generates text more slowly than the sparse model it replaced, roughly half as fast in our tests. Speculative decoding wins most of that back. A draft head guesses several tokens ahead and the main model checks all of them in one pass, so each pass produces more than one token. We use the multi-token-prediction head that ships with the model, so there's no second model to host. In our evaluation it made generation 2.5x faster.
It holds up under load, too. Per-request decode speed drops about 37% between 1 and 8 concurrent requests, but the number of tokens accepted per step stays at about 3.3 throughout. The slowdown is the GPU being shared, not speculation getting worse. That acceptance number is worth watching in your own logs as load rises. If it falls, the draft is the problem. If it stays flat, look at batching.
Things we learned the hard way
The example config is not your config. We once ran a dedicated GPU with a concurrency limit of 4, copied from a setup where the card was shared between four services. Requests queued about a dozen deep while the card sat at 39% utilization. The limit lives in the scheduler, not in the hardware. Raising it to 48 gave us 12x more concurrent requests on the same GPU.
Warm before you take traffic. The first sampled request after a restart spends about 17 seconds compiling kernels. Every start now runs a warm-up that covers concurrent bursts up to full concurrency, constrained output and one very long prefill, and a new box takes a small slice of traffic before we ramp it up.
Load-test the way real traffic behaves. Building the simulator taught us four things.
- Test concurrently. A sequential test never uses more than one slot, so it can't find a concurrency limit.
- Ignore cold benchmarks. The first run is always the slowest and tells you nothing about steady state.
- Stagger arrivals. Our first version started every call at once and showed seconds of p90 at a modest load. That was a stampede of cold first turns, not a capacity limit.
- Simulate the real mix. A version that sent only reply requests, with no tools and no background work, looked two to three times faster than the full simulation.
Check the tokenizer after every upgrade. While testing Model A on Hindi we saw garbled words, and for a while we blamed the model. It was the tokenizer. The library bundled with recent SGLang and vLLM images applied an older splitting rule that cut Hindi words at every vowel sign, into more than twice as many pieces as it should. Setting tokenizer_class to PreTrainedTokenizerFast in the model's tokenizer_config.json loads the tokenizer as shipped. Misspellings in our Hindi test set went to zero, and the same prompt got 8% shorter, which is free prefill time.
If you only remember a few things
- If turn 1 is slow and later turns are fast, check prefix sharing between calls before you touch a single server flag.
- Put everything that changes per call at the end of the prompt, keep the context append-only where you can, and make warm-up requests match real ones exactly.
- Measure your hit rate from the engine's logs, and treat it as a capacity metric. In our tests, 90% and above is where things held up.
- Plan capacity in uncached tokens per second, not slots, and find where your own latency starts to climb.
- Route by prompt prefix, not round-robin, and keep each GPU's set of agents small.
- On models with a running state, warm up with several requests per prefix.
- Size memory for whole conversations, and leave room for kernels that load late.
- Load-test with the real request mix and staggered arrivals, or don't trust the result.
This is the first layer
All of this is about one part of the stack: getting the first token out of the LLM quickly, and keeping it quick as calls pile up. There is a lot more between a caller's voice and ours, and we'll write about it in future posts. If you're working on the same problems, we'd love to compare notes.
Tags: LLM Inference, LLM Optimization, Inference Latency, Prompt Caching, Voice AI, GPU Optimization, SGLang, AI Infrastructure